1.1 Twistlock Overview
Twistlock was founded in December 2015. It was the first container cybersecurity platform. The company was acquired by Palo Alto Networks in July 2019 for almost half a billion dollars. This case study focuses on the Cloud Containers Radar.
1.2 Case Study Overview
Cloud Containers Radar is the primary interface for monitoring and understanding environments. The 18.11 version is demonstrated in the case study.
1.3 Problem Statement
The main goal was to improve value for our users. Mainly to the CISO teams (mostly security engineers, also called SecOps). Prior to developing this version for the radar, the data was very basic, only showing clusters, and there was no way to investigate a specific entity in terms of its vulnerabilities, compliance, and events.
1.4 Roles & Responsibilities
My responsibilities included UX and UI. I worked closely with PM and DEV (FrontEnd and BeckEnd).
1.5 UX Research
The UX research I conducted was qualitative. The company had a policy not to speak directly to users other than customer success managers (CSMs). So I sent a survey to our 10 CSM (at the time). Each CSM handled at least 30 clients. The result was actually input from 300 clients at that time. A detailed interview was then conducted with each CSM and the results were presented to Twistlock's PM and R&D teams. The main takeaway from this research was that DevOps teams are not interested in this visualization. They prefer using data tables.
1.6 Scope & Constraints
This was part of a 3-month release we had. Work was in the SCRAM method.
1.7 Outcomes & Lessons
UX/UI improvements are included in this version to enable SecOps to truly understand their environments and to navigate easily throughout all the data. The Radar canvas not only provides users with a visual representation of all microservice connections, but they can also drill into a per-layer vulnerability analysis, check for compliance, and investigate incidents without leaving the canvas. Everything can now be accessed directly from Radar. Twistlock has changed its product. Security engineers, in particular, loved the radar. Later on, we developed other radars as well.
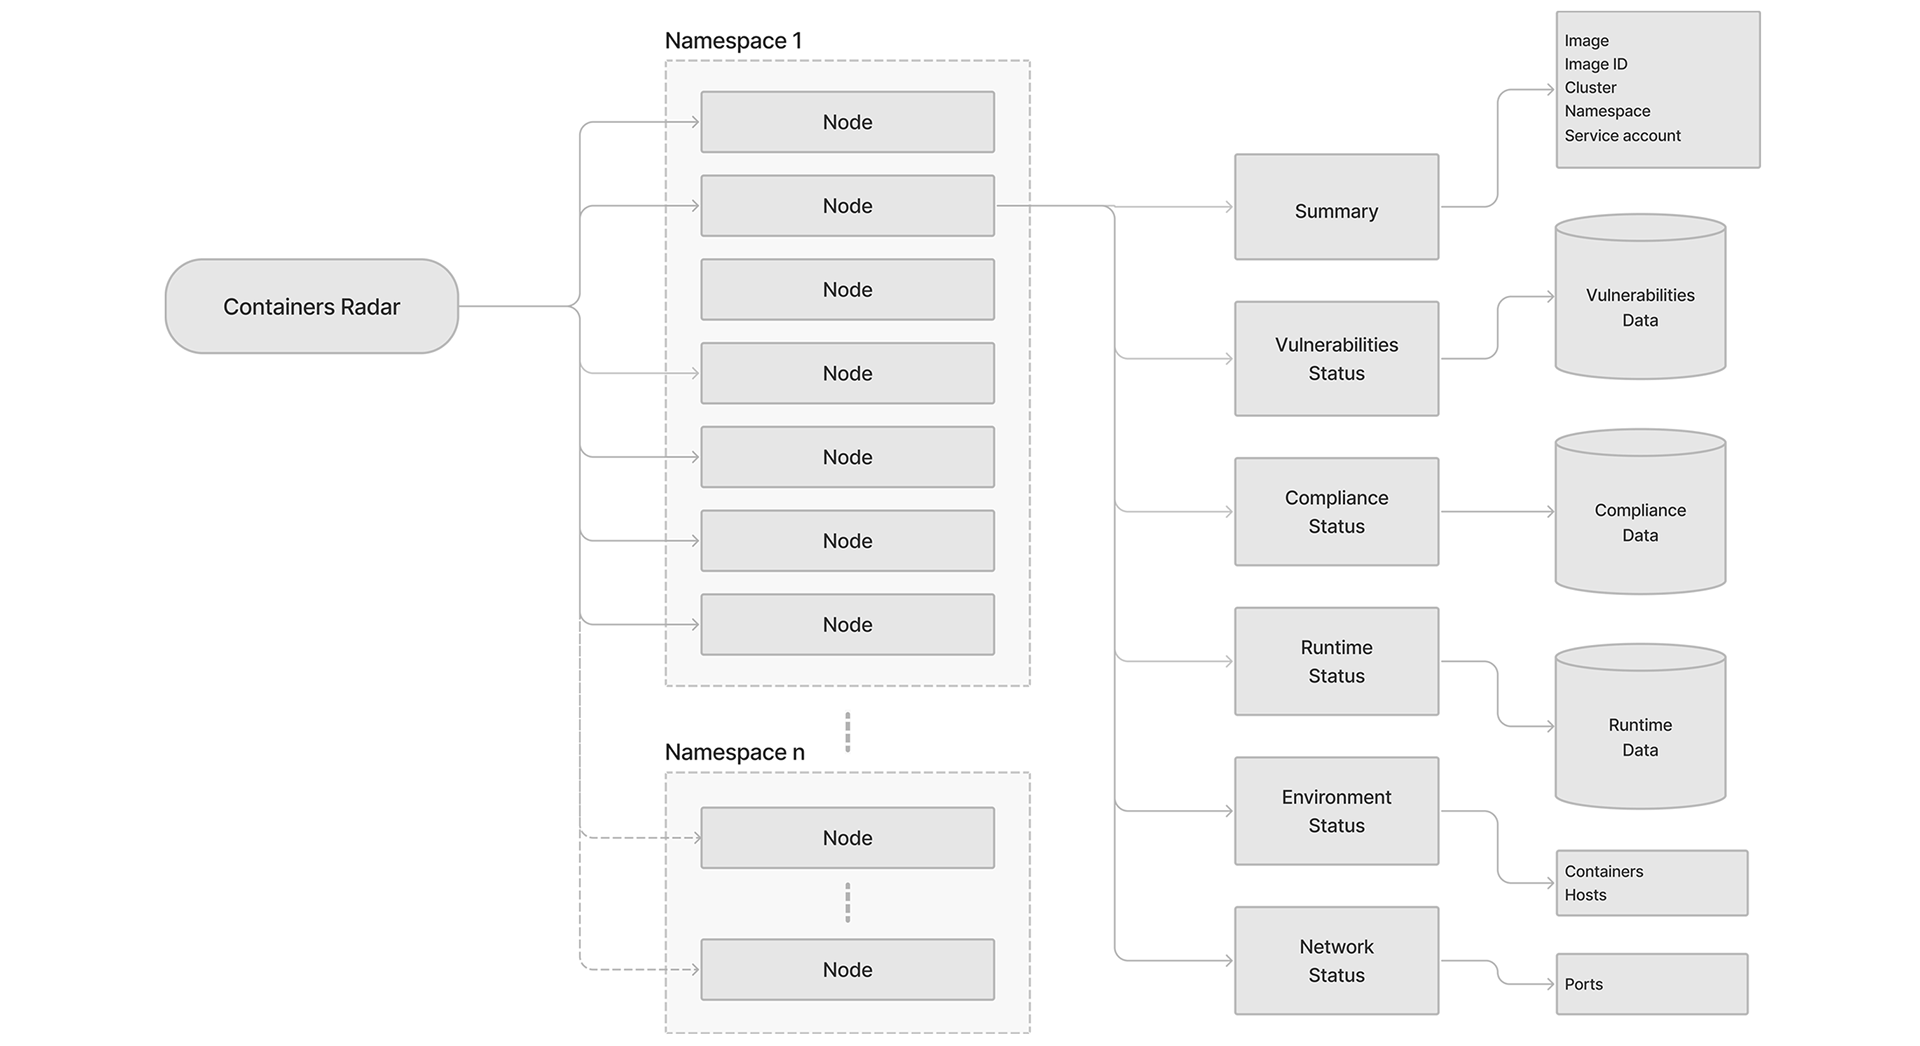
Initial flow chart for the Containers Radar
Our whiteboard sessions resulted in a flow chart. It was quite an initial flow chart for the Containers Radar, but a good starting point for the wireframing process.
Our whiteboard sessions resulted in a flow chart. It was quite an initial flow chart for the Containers Radar, but a good starting point for the wireframing process.
Wireframe 1 – General view of the Radar
Wireframes were created in Axure and changed at least six times before we even started working on the UI. Discussions included DEVs, PMs, and myself.
Wireframes were created in Axure and changed at least six times before we even started working on the UI. Discussions included DEVs, PMs, and myself.
Wireframe 2 – Zoom in on a namespace
The challenge was to create value for the user, whether it is the DevOps or the SecOps.
The challenge was to create value for the user, whether it is the DevOps or the SecOps.
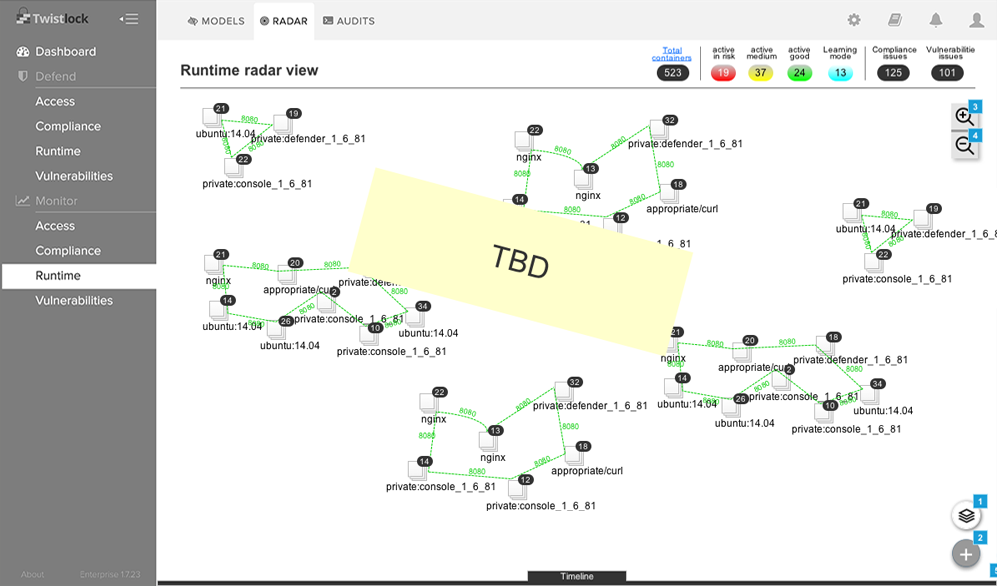
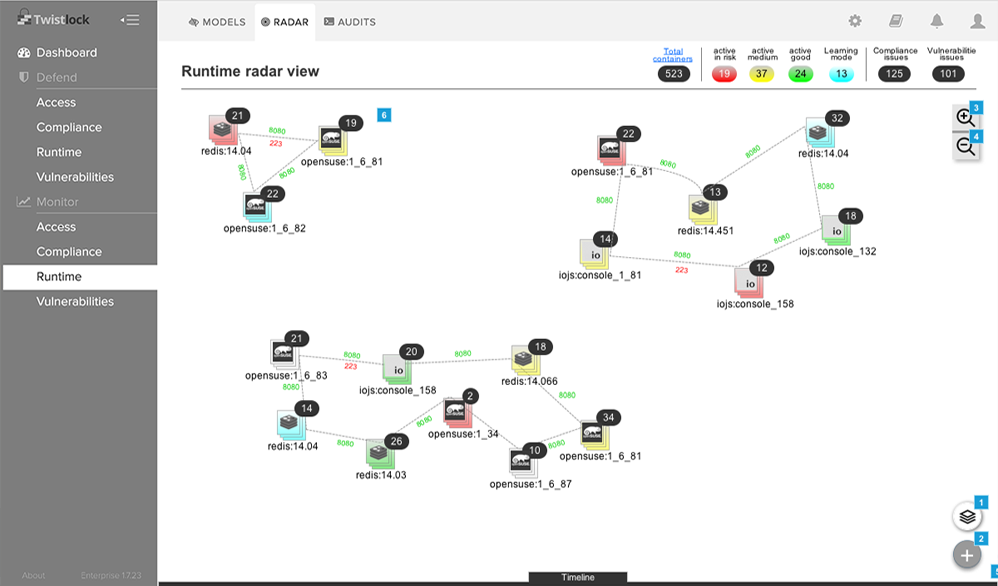
Wireframe 3 – Zoom out on
A wide-angle view of the current situation was the primary purpose.
A wide-angle view of the current situation was the primary purpose.
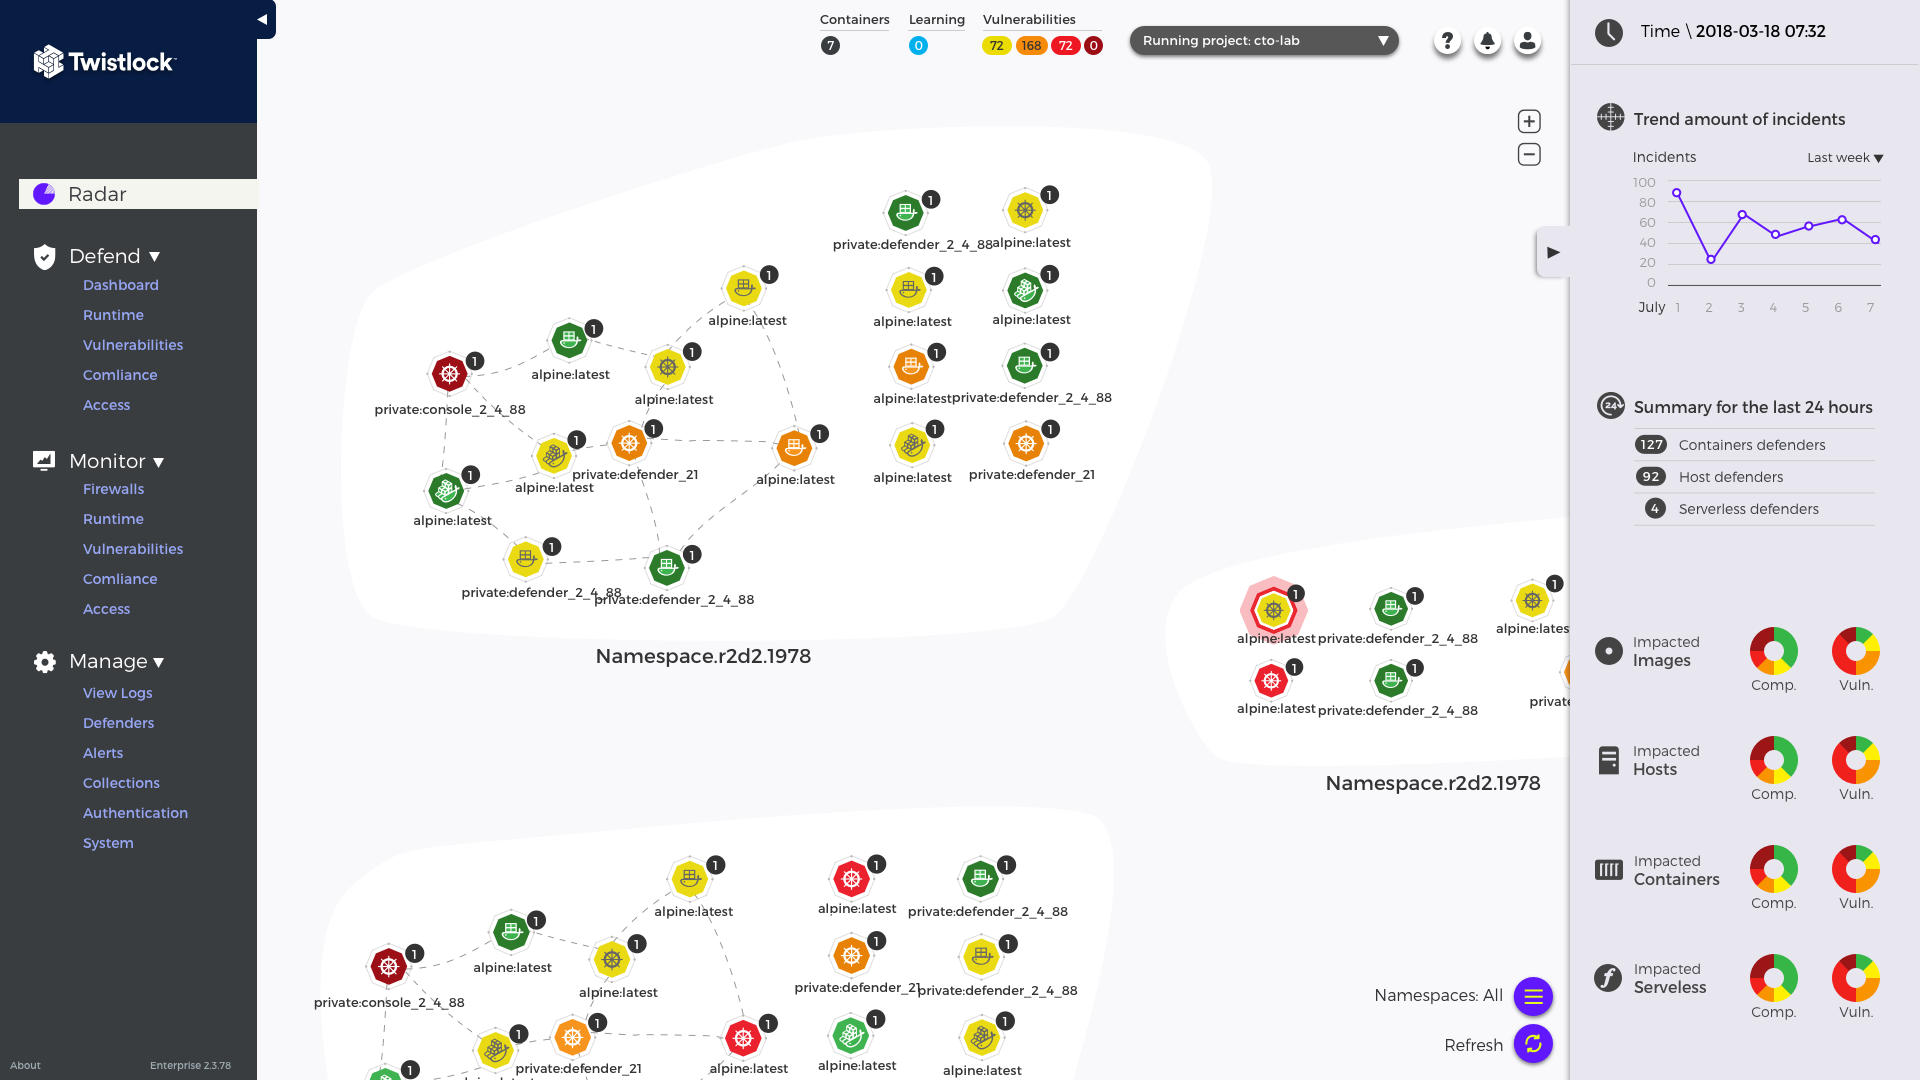
UI (Visual design)
General view. A right-side panel (a drawer) was added with high-level information.
General view. A right-side panel (a drawer) was added with high-level information.

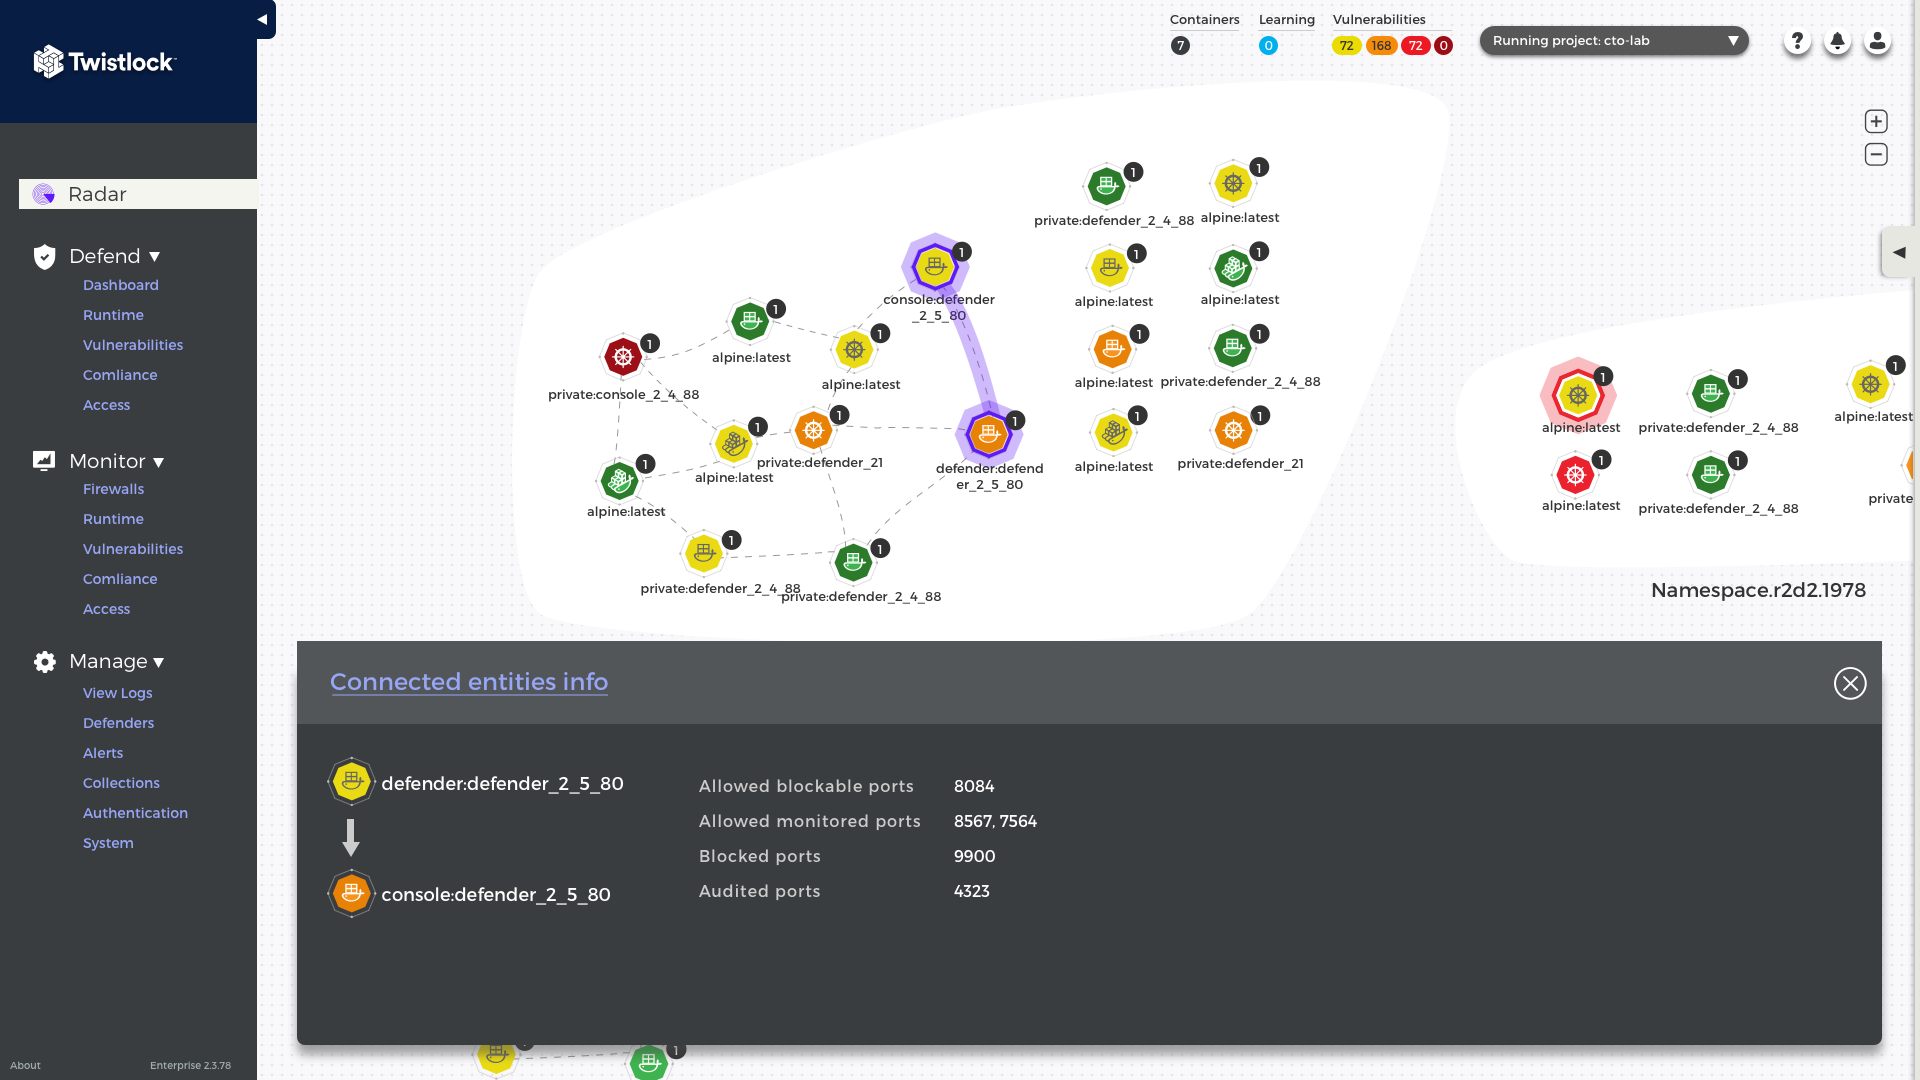
Preliminary information per entity
This version allows the user to have focused information on vulnerabilities issues, compliance issues, and many more data after it was scanned by the Twistlock defenders.
This version allows the user to have focused information on vulnerabilities issues, compliance issues, and many more data after it was scanned by the Twistlock defenders.
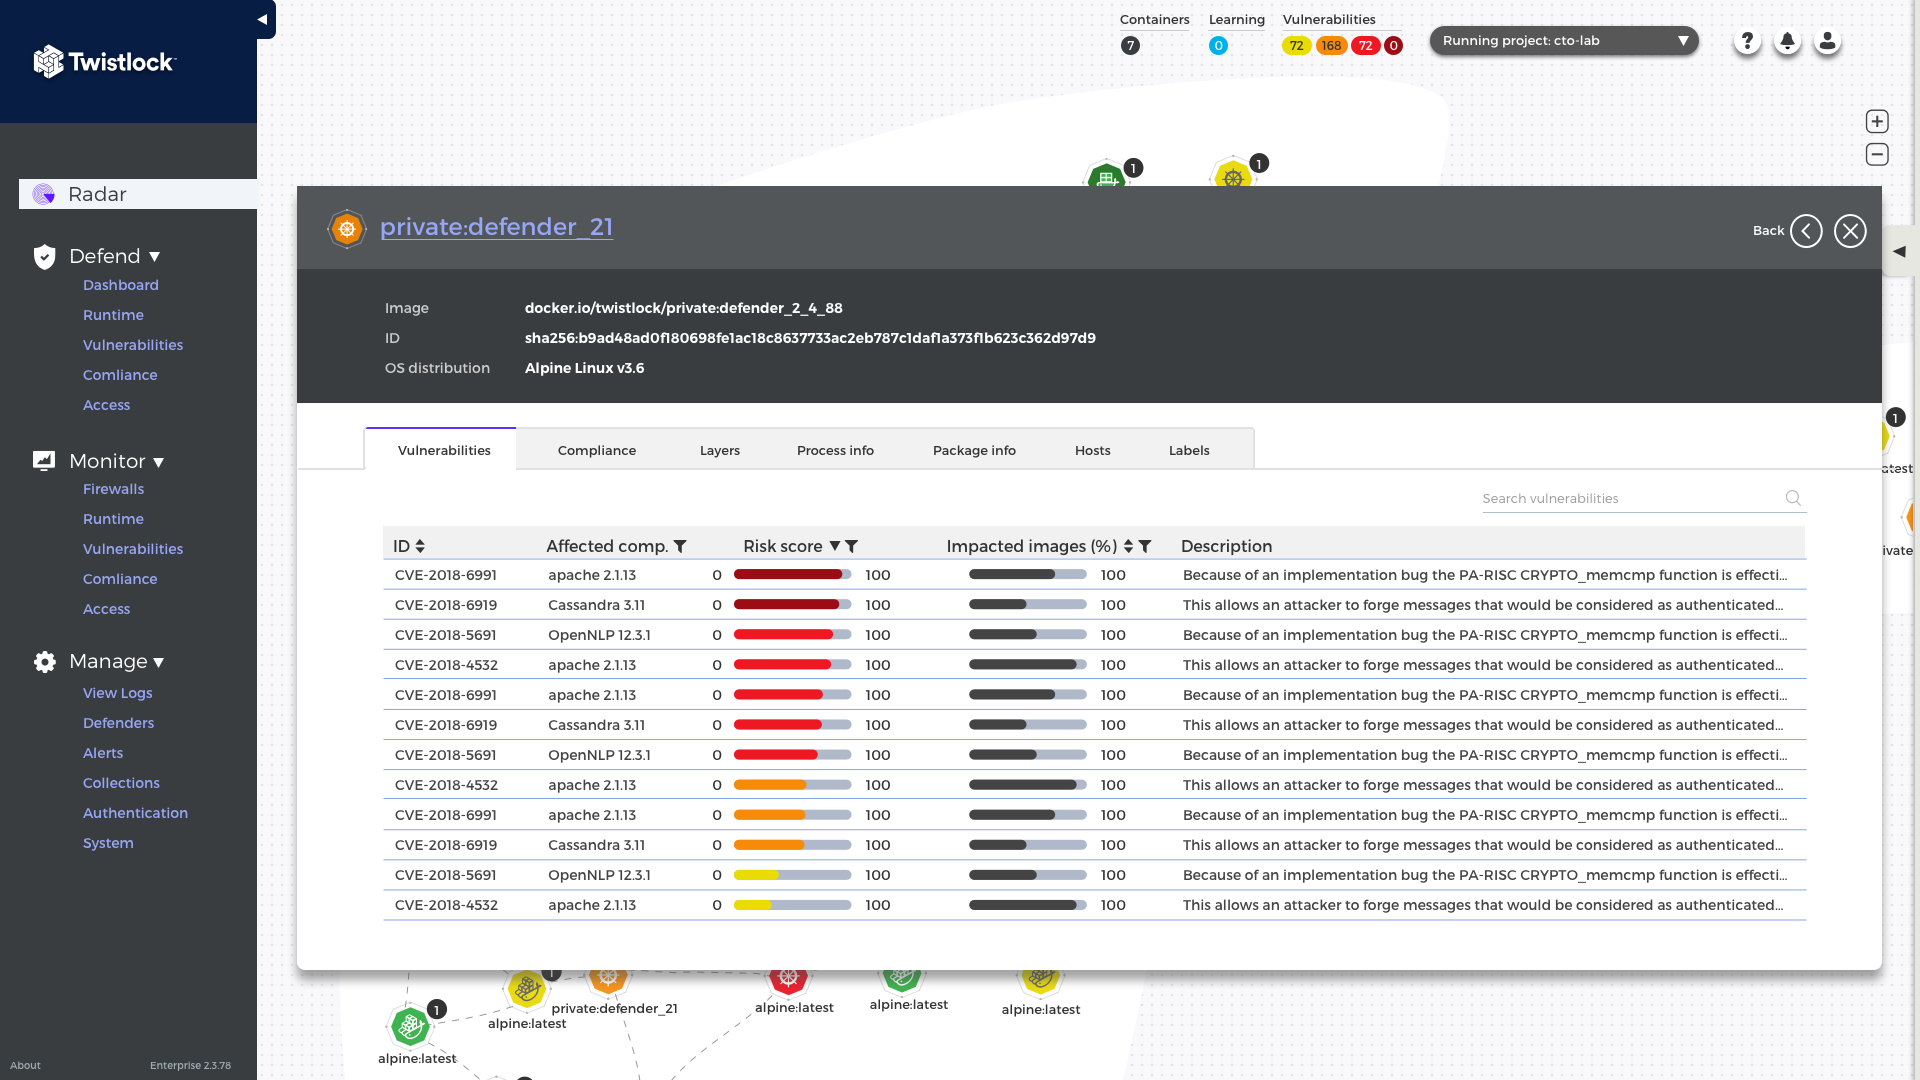
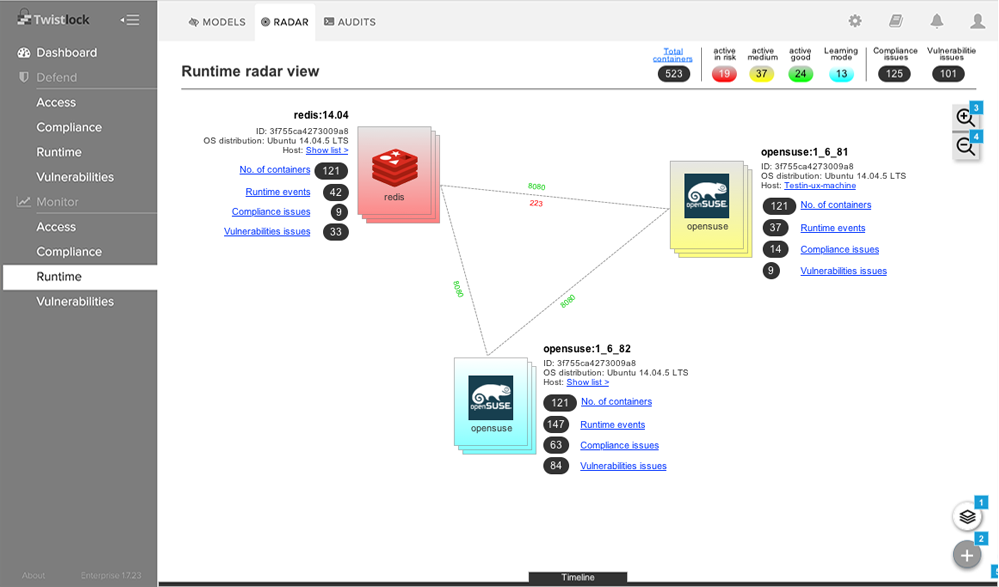
Drilled down information
This version has the ability to go even deeper and show relevant information, supporting the investigation, and connectivity to other sections of the Twistlock product.
This version has the ability to go even deeper and show relevant information, supporting the investigation, and connectivity to other sections of the Twistlock product.
Twistlock Radar 18.11 animation